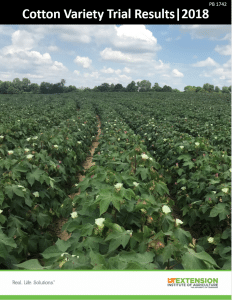
 The 2020 TN Cotton Variety Guide is now available online. This preliminary report serves as a precursor to the complete Variety Trial Results which will be published after the remaining samples have been ginned and classed. Summary tables from the 2019 season were calculated from five Official Variety Trials (OVTs) and nine County Standard Trials (CSTs) scattered throughout TN’s cotton producing counties. Continue reading
All posts by Ryan Blair, County Variety Trial Coordinator
2019 CST Soybean Data
The 2019 County Standardized Trial-Soybean Results are now available.
This year, the trials evaluated 88 soybean varieties from 15 companies at 71 locations. Across all varieties and maturities, the tests averaged just over 60 bu/ac. Sufficient rains and soil moisture got this crop off to a great start and earlier planted beans showed no sign of drought stress in most locations. As the season went on, July and August offered little rain to much of TN and later planted beans suffered during pod fill and showed reduced yields in many locations. Maturity and herbicide tolerance is split into 6 protocols. Glyphosate/Dicamba tolerant varieties are tested in four separate trials; late MG III, early MG IV, late MG IV, and early MG V. Our Glufosinate tolerant trial, now hosting some 2-4-D tolerant varieties are separated into two trials; early MG IV and late MG IV.
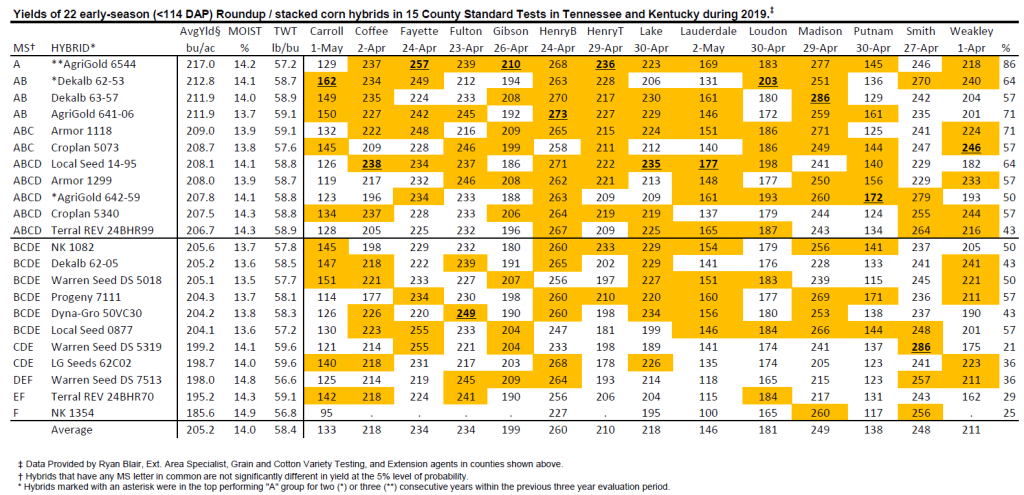
2019 County Standardized Trials Corn Data
The 2019 County Standardized Trials data are now available. This year, 58 hybrids were evaluated with 49 test locations being harvested. A great corn year brings the overall average across all locations and hybrids to 206 bu/ac. The tables are separated into 3 maturity groups, early <114 day, medium 114-116 day, and full >116 day corn. Hybrids are listed in descending order within each maturity across locations. UT recommends selecting hybrids that are in the A group statistically. Hybrids with *’s next to their name, have been in the A group for consecutive years. Two (**) indicate this hybrid has been in the A group for 3 consecutive years.
A special thanks to those companies involved in these trials for sending a great lineup. Thank you to all the county agents involved in getting these trials in and out. Thank you especially to the producers who allow these trials to be placed in their fields to provide all of Tennessee with a non-bias look at head to head yield comparisons across the state.
Tennessee Wheat Variety Trials: 2019 data
The Tennessee Wheat Variety Trial data from 2019 is now available. To access the publication, click the below image or navigate to this web address: https://news.utcrops.com/wp-content/uploads/2019/08/Wheat-Variety-Performance-Tests-in-Tennessee-2019.pdf
2018 TN Cotton Variety Trial Results now available (PB1742)
The tech-trait diversity in the top performers again highlights the excellent yield potential, stability and fiber quality currently available in commercial cultivars regardless of tech platform. Trial results reported from the 2018 season include 58 varieties entered into 7 Official Variety Trials (OVTs) and 18 varieties entered into 10 County Standard Trials (CSTs). Both OVTs and CSTs were scattered throughout TN’s cotton producing counties. Additionally, in-season plant measurements and multi-year yield averages were reported for the OVTs.
We will be releasing results from a June planted OVT later this winter, so keep an eye out for those results on this blog.
Special thanks to all those who participated and/or contributed to the program during the 2018 growing season, and look forward to seeing many of you during our 2019 meetings.
2017/2018 County Standard Wheat Trials
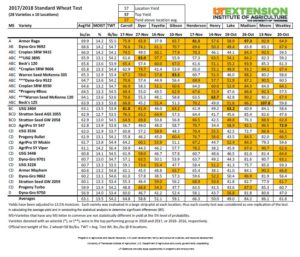
2018 County Standardized Trials (CST) wheat harvest data are now available. Our county trial yields were consistent with yields in much of the state, down around 15 bu from what we had last year. Late planting due to excess moisture and a cool, wet spring with delayed fertilizer and insecticide applications, didn’t get this crop set up for record year. 
2017 CST Wheat Yield Results
2017 County Standardized Trial (CST) Wheat yield data is now complete. CST plots are large on-farm strip trials using farmers normal production practices, and represent common production environments. Included in the table are 12 test, harvested from 11 counties across much of West TN and into Middle TN coving a wide range of Continue reading


