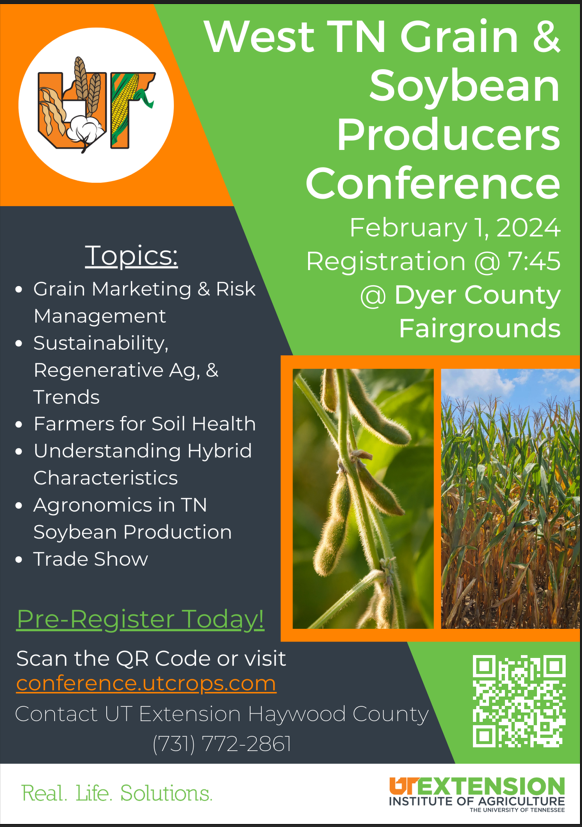
The Tennessee Top Bean soybean yield contest sponsored by the TN Soybean Promotion board and coordinated by UT Extension is open for entries now until September 1st for the 2024 season.
10
Jul
2024

The Tennessee Top Bean soybean yield contest sponsored by the TN Soybean Promotion board and coordinated by UT Extension is open for entries now until September 1st for the 2024 season.
This year’s County Standardized Trials, Wheat Program tested 23 varieties of Soft Red Winter Wheat in 10 locations. Seven of those locations where used to compile our variety recommendations for the 2024 fall planting. Over all, yields across varieties and locations averaged just over 76 bu/ac, with an average of 10.4% moisture and 55.1 lb testweight.
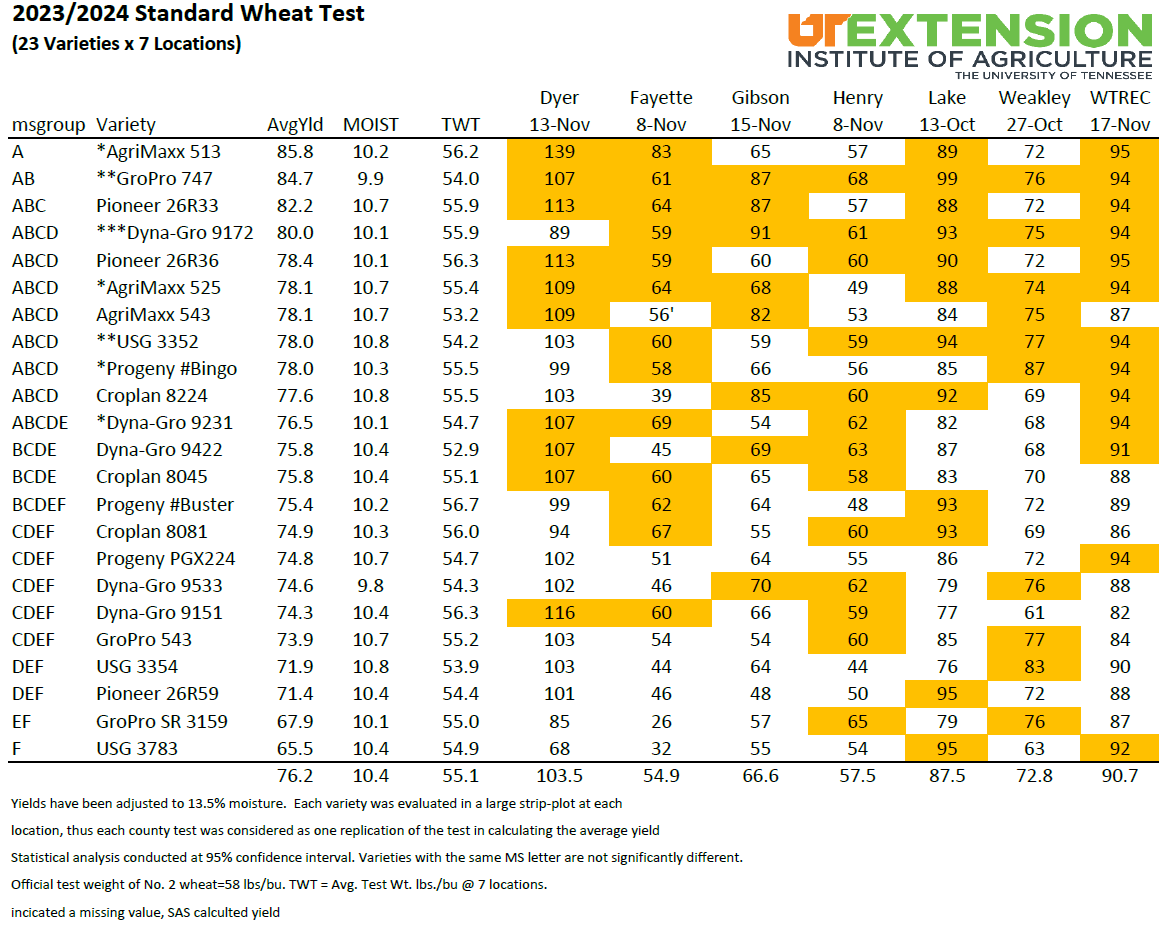
Thank you to all the producer who put these trials out and the County Agents who organized and oversee these variety plots. Also, a special thanks to our cooperating companies who supply seed and genetics to test in our environment. Wheat yields have increased dramatically over the years, better genetics and breeding programs along with state and local testing are proving to add weight to the combine and increase profits for wheat growers in TN.
If you are interested in having a County Standardized Trial (Corn, Soy, Cotton, Wheat) on your farm, contact your local County Extension office for more details.
This Fall, contact your seed suppliers and request wheat seed from the list above with confidence from our unbias variety testing program.
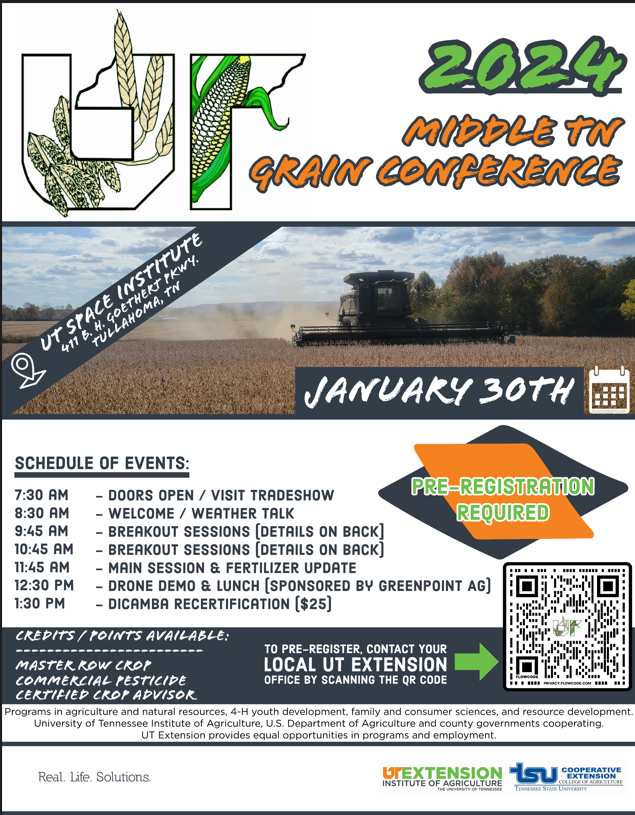
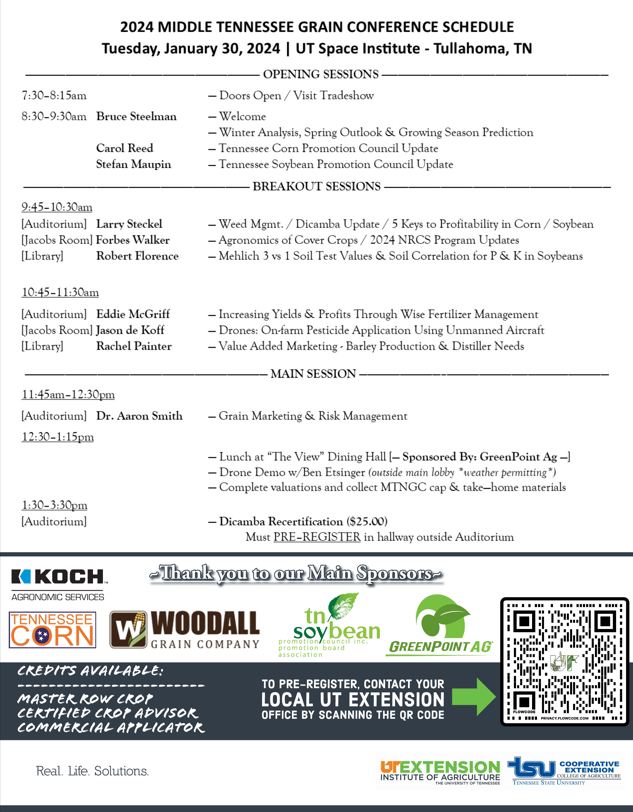
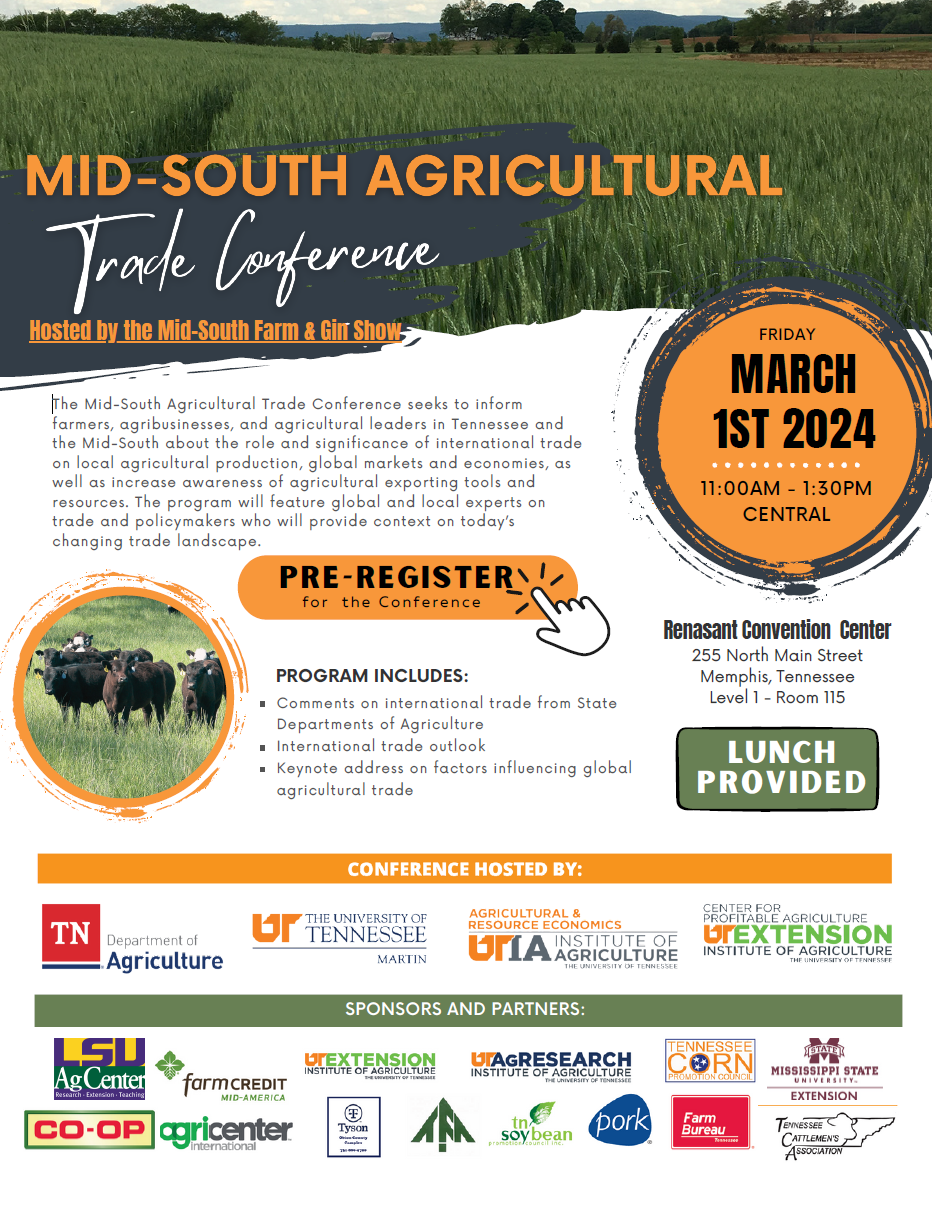
Come join us in Memphis at the Trade Conference, hosted by the Mid-South Farm & Gin Show
Thanks to all the agents and producers who entered the 2023 TN Top Soybean Yield Contest sponsored by Tennessee Soybean Promotion Board. There were over 50 producers across TN who participated in the 2023 contest. See the winners below!
For more information, please contact your local County Extension office. Notice of Intent for the 2024 Yield Contest are due in early September.
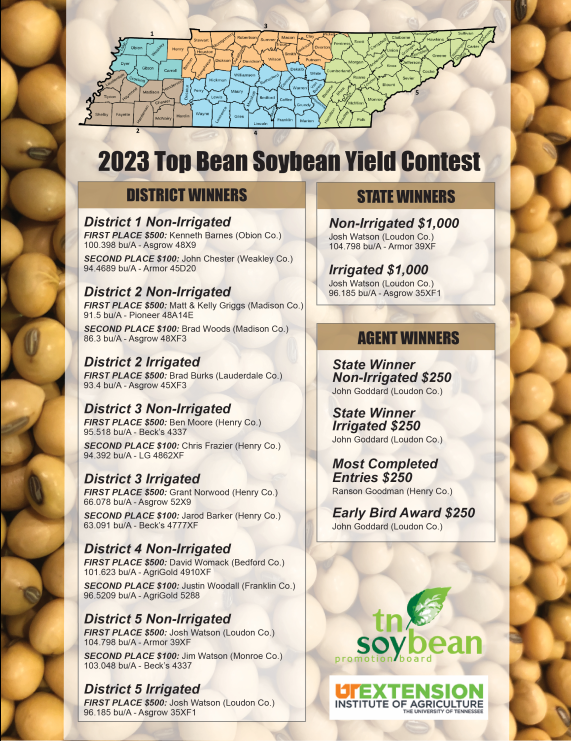
Complete contest rules and forms are available at your County Extension Office
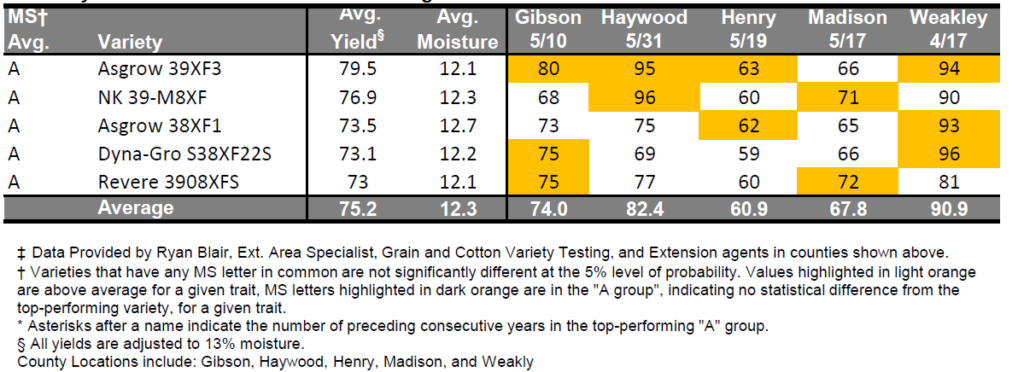
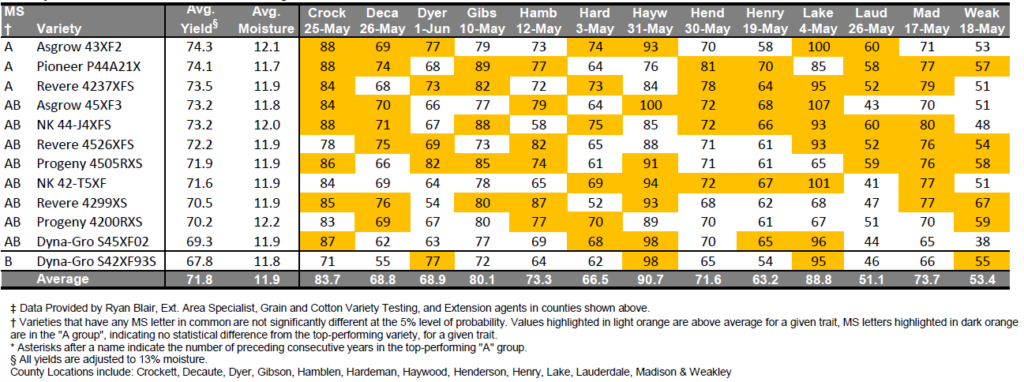
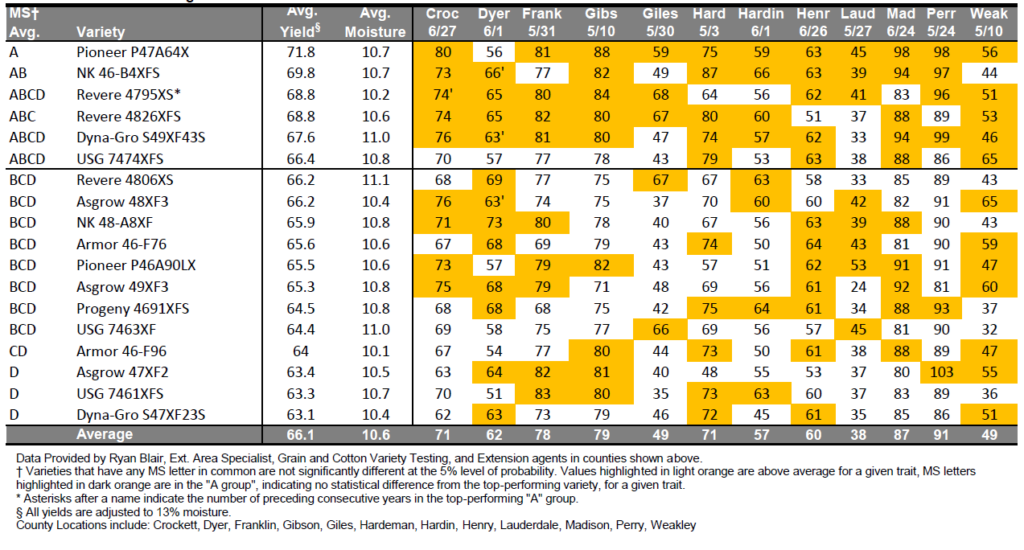
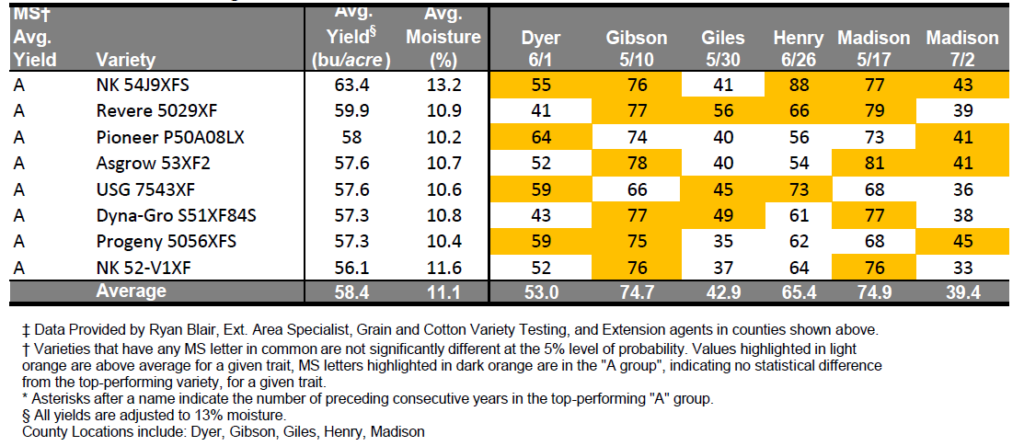
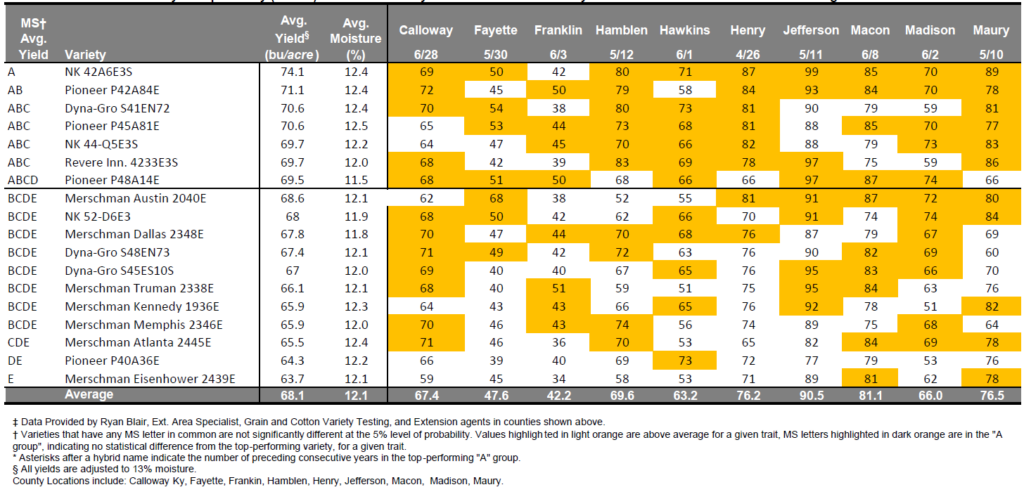
This year’s soybean CST class consist of 61 varieties covering late 3’s to early 5’s maturity groups. These trials are split by both maturity groups and herbicide tolerance, Late III, Early IV, Late IV, and Early V, and by Xtend and Enlist. These trials were planted on-farm across the state in 63 county demonstration plots.
If you have questions about UT’s variety testing program, please contact your local county agent.
Thanks to all who contribute to these trials and your support to the program.
Click on the table below to enlarge data in pdf form.
Late III Xtend
Early IV Xtend
Late IV Xtend
Early V Xtend
Enlist
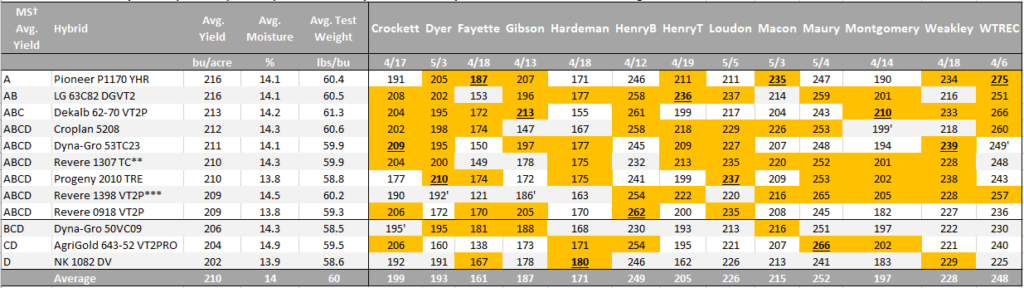
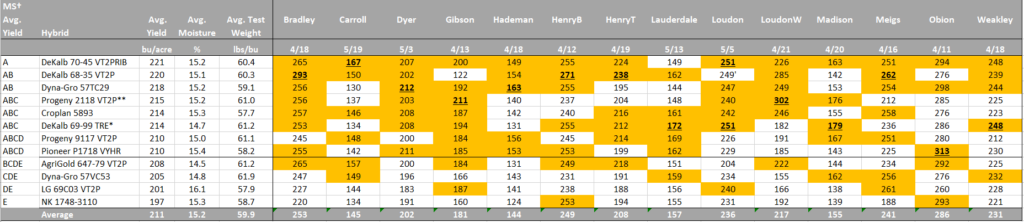
39 Corn Hybrids were evaluated in the 2023 CST program. With the weather we had this summer, our yields are very strong with an overall average across all hybrids and locations over 210 bu/ac. With the many locations/replications in these trials, we can look at performance across many soil types and weather/climate conditions that you can use to help select high yielding, consistent hybrids to bring to your farm. Contact your local county agent for more details or if you need a print out of this data.
These CST plots are large strip trials located ‘on-farm’ with a minimum of 300 feet in length. Inputs and management decisions are on a by location basis and determined by the cooperating producers. Three relative maturity groups divide the trials, Early Corn will be 113 day and earlier, Medium Corn will be 114-116 day, and Full Corn is 117 day plus. Thank you to everyone involved in the CST program for your support and contributions: County Agents, UT Extension/Research, Growers, Industry, Retail.
Below are the results for our 3 RM groups. Click on the table to open a PDF of these tables. These results can also be accessed on https://search.utcrops.com/