The front which moved through this past weekend (3/18-3/20) brought low temperatures down within a few degrees of records set back in 1965. Based on the growth stage and temperatures observed, I believe we will see damage in some of our wheat. In this blog article, I cover basic information on the conditions that led to the injury and how best to assess the level of injury in your wheat crop following a freeze near jointing.
The two main factors to consider in predicting wheat susceptibility to freeze injury are 1) the growth stage of the wheat and 2) how long and how low temperatures stay at dangerous levels.
I’ve walked several wheat fields this week to get a good feel for wheat growth stage. Wheat planted during early to mid October and into moisture has commonly reached Feekes 7. Later planted acres or acres which were dusted-in range from Feekes 5-6. Wheat susceptibility to freeze injury increases as the growing point leaves the soil surface (Feekes 6). Unfortunately, many of our acres had moved into or past jointing before last weekend.
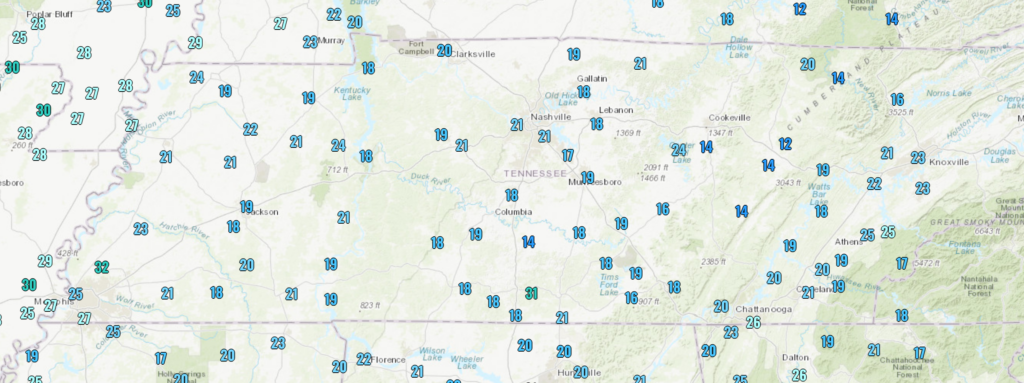
I’ve also reviewed through the hour by hour recorded low temperatures from this weekend- you can see the observed lows for 3/20 below. Many wheat fields flirted with 2 hours at or below 24F on Saturday night (3/19) before spending over 4 hours below 24F on Sunday night (3/20). The 2 hours below 24F threshold is important because many resources covering freeze injury in small grains suggest 2 hours below 24F at jointing can kill the growing point, damage leaves and stems, and culminate into moderate to severe yield penalties.
Based on the reported temperatures and growth stage of much of our wheat crop, it is very likely that we will eventually observe injury on wheat which had moved past jointing. Injury will take some time to become visible (possibly a week or longer) and assessing the level of injury even then will be time consuming. Although stem and leaf injury will likely develop, I am most interested in assessing damage to the growing point.
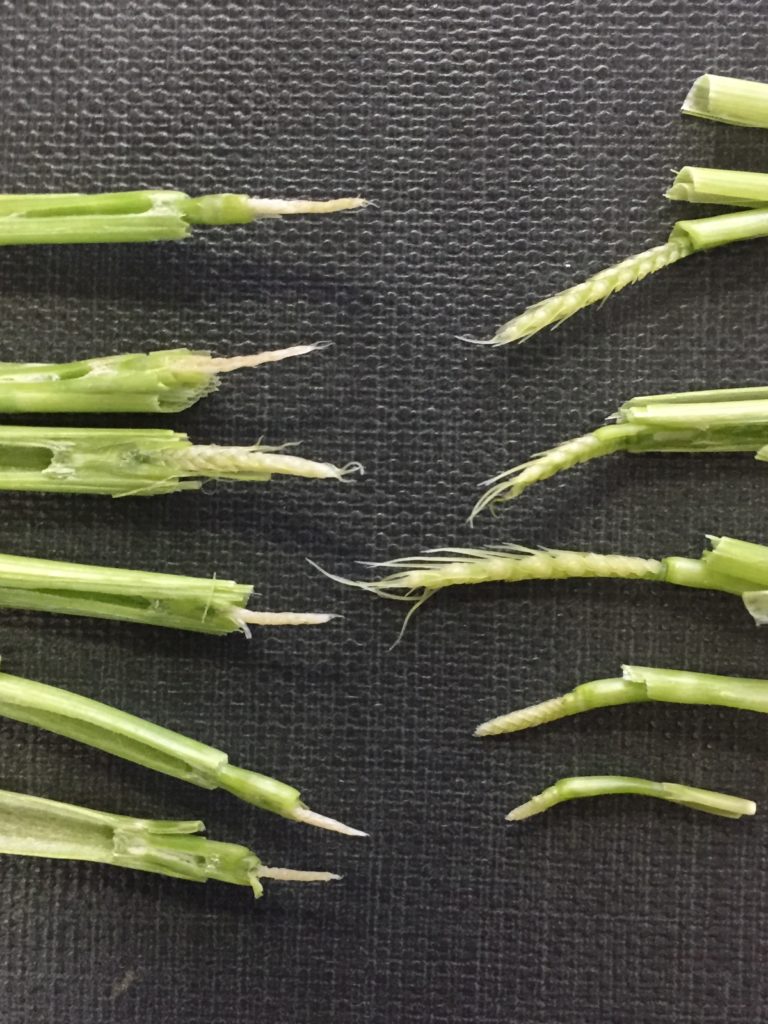
Injured growing points will appear shriveled and do not look like miniature versions of mature heads. By next week, many of the injured growing points will appear yellow, tan or white and look more like paint brush tips than wheat heads. Terminated heads will cause the highest yield penalties. Compensation from other uninjured tillers can prevent severe yield penalties but harvest date may be delayed. Below is a picture of healthy growing points (right) versus injured growing points (left) from 2017. A few more comments on the injury we observed in 2017 will come at the end of this article.
Assessing injury is the first step in making a management plan moving forward. The list factors which should be considered before terminating a wheat stand are substantial and include insurance, inputs applied, plant-back restrictions from herbicides used (See Dr. Steckel’s post from 2017) and cash flow, to list a few. On injured wheat fields, I would suggest modifying your yield goal and placing a critical eye on every input yet to be applied.
Now to circle back on 2017- many of you may recall a similar cold snap in mid-March of that year. Low temperatures during March of 2017 fell below freezing for a 6 day period, with lows in Jackson falling to 23F on both the night of the 15th and 16th of 2017. Although the damage experienced this year will likely be worse than damage experienced in 2017, the average wheat yield per acre in Tennessee during 2017 was 70 bushels/acre. There is a good chance, in my opinion, that many 2023 wheat fields will escape the temperatures of last weekend unscathed. I’ll provide an update next week as we begin to better understand actual impact.
