 A friend of mine shared a picture over the weekend of a dead snake on a fence and he’s recently started closing emails with the line ‘PRAY FOR RAIN’. As for me, all of my truck windows are down, the sprinkler is on in my yard, and I’ve got clothes hanging outside even though the dryer in the house works great.
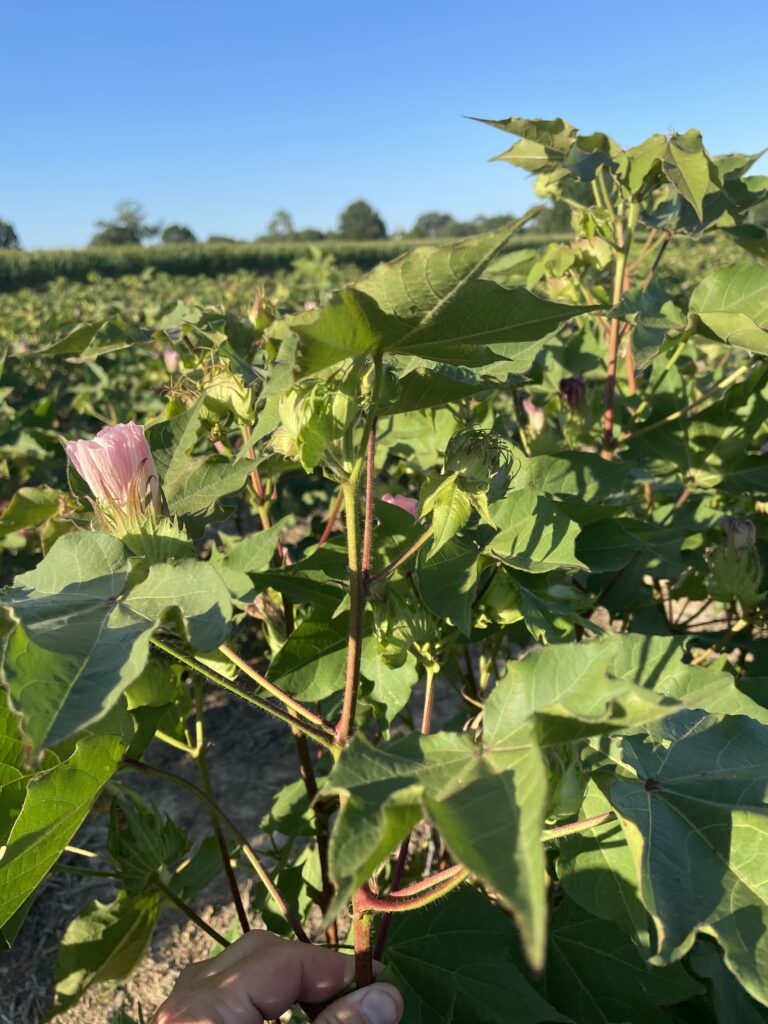
Drought conditions have developed through much of West Tennessee and much of our cotton crop is beginning to show signs of stress. Cotton is a drought tolerant plant which can tolerate water deficits, but we are reaching a point where yield has been impacted. I’ve had numerous discussions over the past week on heat unit accumulations, Node Above White Flower (NAWF) counts at first bloom, and how we should think about insect thresholds when the fruiting positions currently on the plant may makeup the largest percentage of our yield at the end of the year. In this blog, I cover heat units accumulated until today, spend some time describing the target development curve out of Arkansas and how the curve is developing in the 2022 TN crop.
It has been hot through much of June and July. Although cooler nights have prevailed in the past few days, I had to check the thermometer twice several nights late last week; temperatures held in the low 90s and upper 80s well past dark. Warm temperatures are generally good for cotton, but high night temperatures are universally bad. I’m happy that the evenings have moved back to a more tolerable range this week (7/11).
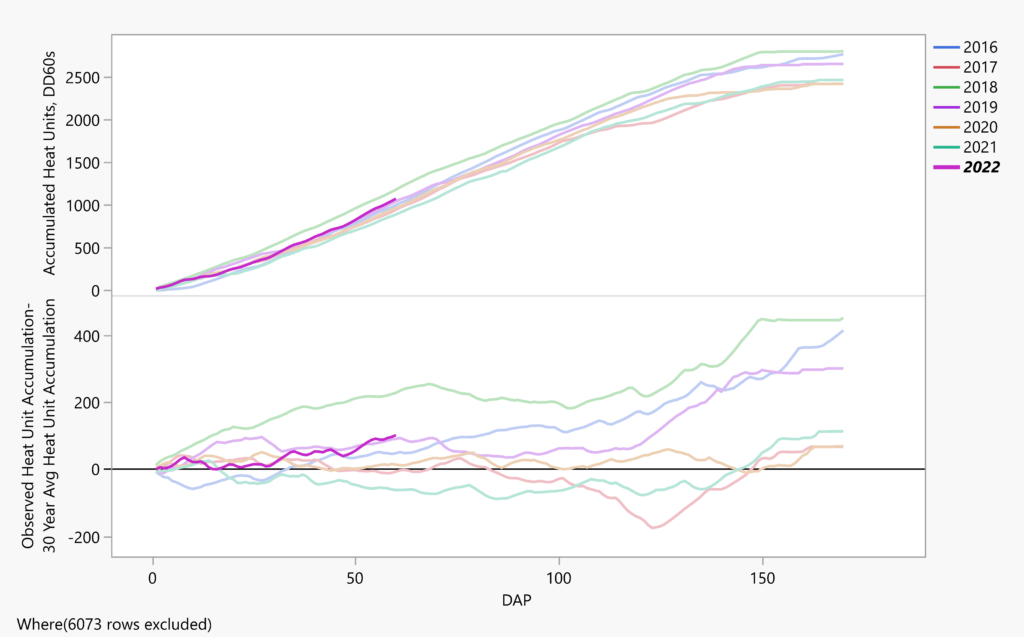
Heat unit accumulation for 2022 is very different than 2021; instead of June setting us back like it did in 2021, June generally pushed us ahead in 2022; we are currently running 100 heat units above our 30 year average with 1,071 heat units accumulated in Jackson since May 15th (Figure below). Unfortunately, it takes more than heat units to capture the status of the 2022 crop and we are currently suffering from drought stress exacerbated by heat stress.
I think the best way to capture our current crop status is to graph our crop against the Target Development Curve (TDC). The TDC was generated in Arkansas in the 1990s and serves as the backbone to the COTMAN Cotton Management System. The curve represents a collaborative effort between physiologists, breeders, agronomists and entomologists with countless years of experience to describe an ideal cotton plant. I’ve included a graph of the TDC below. On the left axis, we have number of squaring nodes. Along the bottom axis we have days after planting. Assuming normal growth, the cotton plant should begin squaring 35 days after planting and should add a squaring node every 2.7 days after that. At approximately 60 days after planting, our first flower should be present on the plant. If conditions have been ideal, we will enter flowering with 9.25 squaring nodes above the first flower. This number (Nodes Above White Flower (NAWF), measured by counting nodes with leaves larger than a quarter above an open, first position white flower) and how it progresses as we move into late July, will be the best indicator of our crop condition.
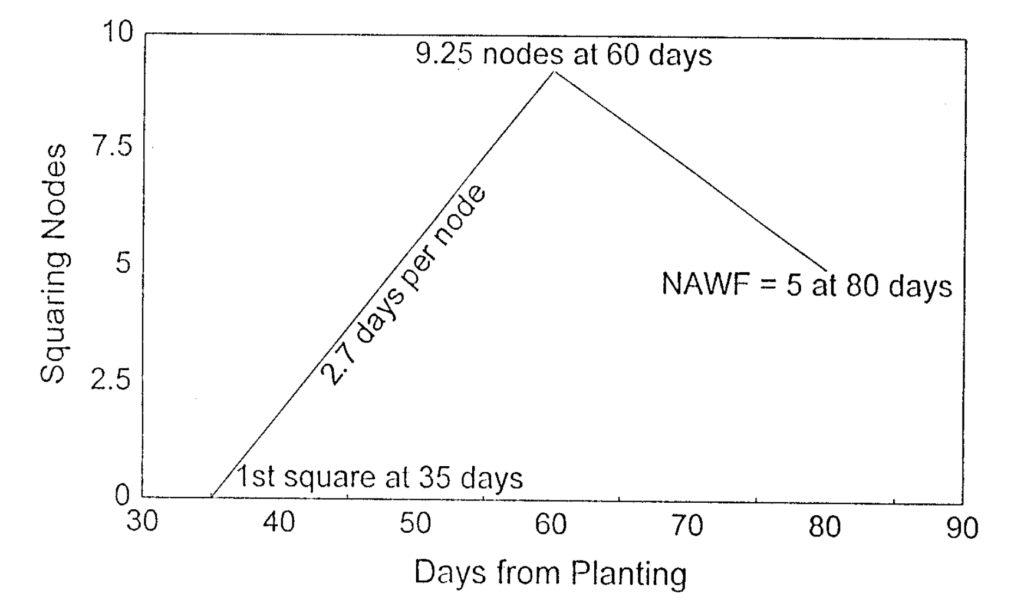
Critiques of the Target Development Curve (and management approach) would suggest ideal curves change with varieties and it is possible to enter flower under 9.25 NAWF and still produce a tremendous crop. Furthermore, our best crops may ride 5 NAWF for a considerable amount of time before reproductive growth overtakes vegetative growth. Although both of these may be true, the TDC published by Bourland et al. represents, in my opinion, the norm; while it is possible to deviate from this curve and still reach very high yields, it is generally unlikely.
The Bad News
I want to start the next section of this blog by first stating the cotton I have graphed below is located on the West Tennessee Research and Education Center and Jackson has not had a notable rainfall event in over 37 days; while some acres will be well-characterized by the graphs below, I believe the majority of Tennessee’s acres will be in better (albeit, slightly) shape. Still, spending time investigating the response in Jackson should help us understand how drought is impacting all acres.
The red line in the below figure represents NG 3195 B3XF planted on April 29th. Many of you will recognize this variety as an extremely high yielding early maturing variety which performed very well in the area during 2021. Many of you will also remember that placement of this variety was critical; it is one of our most determinate varieties and, as such, we wanted to place it in deep silt-loam bottoms or under irrigation. This was the first cotton in my program to reach flower (June 29th) and it entered flower with 6 NAWF. Since the 29th of June, NAWF counts have declined at almost the exact same rate of the Target Development Curve; NAWF 5 was reached on the 4th of July and NAWF 3 on the 11th. Unless multiple sequential, substantial rainfall events fall in the coming week, the NAWF count decline on these acres will likely continue at the current rate before hovering just above 0 until harvest or drought stress subsides. This field entered flower with 3.25 fewer squaring nodes than the ideal cotton plant (graphed by the TDC) and the effective flowering window for this field will likely close 14 days earlier than our target flowering window- again, graphed by the TDC. With such a short effective flowering window, I expect yield in this trial will likely be around half what it was last year. 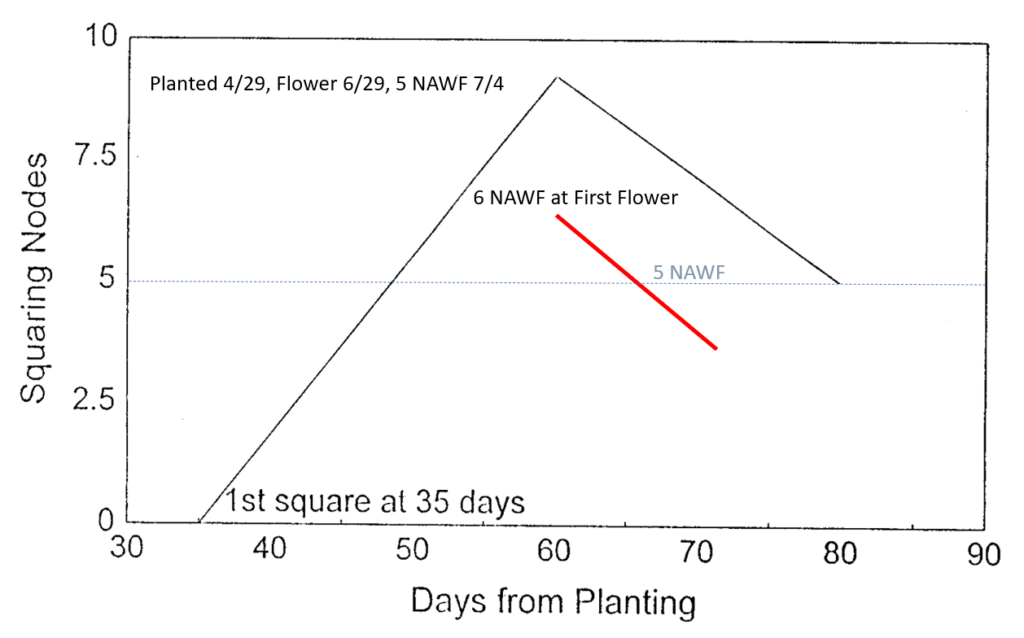
Based on reports and field visits, I believe average NAWF counts at first flower during this year average between 7 and 8. Many of you who watch these numbers may remember that NAWF at flower was relatively low last year, as it is this year. Last year would best be characterized as a rocky start but when the 2021 crop entered flower it had every resource it needed; as result it was able to ‘flatten the curve’ and maintained larger than normal NAWF counts over a longer time frame- basically, lengthening the effective flowering period.
While the 2022 crop is entering flower with similar NAWF counts as 2021, the 2022 crop does not have the resources it needs; all fields need rainfall and many fields haven’t even received enough rainfall to move fertilizer into the effective rooting zone. Rate of NAWF decline will remain higher than normal (and much higher than 2021) if we do not receive multiple soaking rainfalls soon. Long in short, all signs suggest our effective flowering window will be short this year.
The Good News
Our best chance at making this crop hinges on making the most of our current fruiting positions and decreasing the rate at which NAWF declines. Retention in most acres has been good to excellent, even with some reports of environmental shed. If we can catch a few rainfall events over the next few weeks, we have a chance to extend our effective flowering window and still reach respectable yields.
Furthermore, it is possible for the curve to ‘rebound’; plants which bloom out of the top can see a rebound in squaring node counts and a secondary peak with inches of rain across a two or three week period. If rainfall does not resume soon and instead begins to fall in mid or late August, we may be managing a very early bottom crop and a very late top crop.
What do I do about it?
Up to this point you might think this is an article written to simply commiserate. It is not. There are two reasons, in my opinion, this information is important for you to consider now. First, our yield potential is beginning to decline. Cotton can compensate and surprise, but we need rainfall now. I would begin looking critically at all inputs moving forward and cut the ones that are not absolutely necessary.
Second, thresholds. Dr. Sebe Brown is posting an article this week on adjustments to insect thresholds. I’ve spent hours discussing this over the past few weeks with Dr. Brown and others. At the moment, it appears we will manage fewer fruiting positions than we’ve seen in the past 10 years. Dr. Brown’s article outlines the decision well; a single plant bug will feed on a set number of fruit regardless of yield potential. While I might tolerate 3 per drop in a normal crop, it would be tough for me to watch 3 per drop in this season.
We have an excellent group of economists currently developing materials to help guide you through the drought this year. Expect to hear more about those resources in the following weeks to come. As always, don’t hesitate to reach out to your local county office if you have questions about this or any other content.
Finally, if you know any rain dances. . . now is the time.

I had forgotten about the dead snake on the fence for rain, but will start looking for a snake or two. Also, I remember “it rains on the just & the unjust, but it takes some just in the community for that to happen. Finally, an old farmer friend would say “don’t need to pray for rain, just pray for the wind to blow out’south rot 48 hours & the devil himself couldn’t stop it from raining. It will rain again!
Milton,
Yours to a cinder
Enjoyed your comment. Had a friend call with another one late yesterday afternoon- if you see a turtle cross the road, a rain will fall within 48 hours. He indicated he was considering breaking pond dams to get turtles on the move!