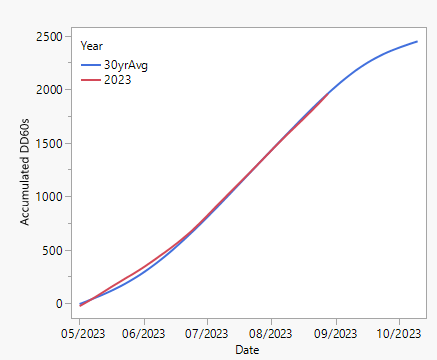
 I’ve had several questions over the past two weeks about how many heat units we have accumulated and how this compares to our average year. As of August 28th, we have accumulated 1,974 DD60s since May 1. We’ve broken from the 30 year average trend line several times throughout the year; May was considerably warmer, June pulled us back to the average trend line, and although we have been rolling above and below the line from the end of July through August, as of August 28th, we are within 15 heat units of the 30 year trend line; on average, by August 28th, we accumulate 1,961 DD60s. As you look at the above graph, you may notice these breaks with the trend line are ever-so-slight. Keep in mind rate of change is important. If you zoom in on several of the regions highlighted above, you can see how our weather this year breaks from the trend line before rejoining it throughout the season.
I’ve completed these calculations from the Jackson, TN Experiment station, and while it is fair to assume you may see some differences if comparing Memphis, Tiptonville and Fayetteville, I would argue these differences are slight; temperature gradients across our region are relatively stable, especially when comparing trend lines over time. Similarly, different plant dates will obviously create slightly different curves, but expect the trends to be very, very similar to this graph.
The main take away from this graph- heat units help us understand the environment the plant has experienced, but they are only one part of the story; a thousand parameters ultimately determine what we take out of the field in October. Our crop has moved from generally late to on time (or ahead of time) with rainfall and/or lack-of, depending on the timeframe in this season.
While there are a few things I would have liked to change about this season, there aren’t many. This looks to be a very, very good crop.
