*Posted on behalf of Dr. Aaron Smith. A pdf of this article can be accessed by clicking the title below*
Correlation between Stock Markets and Cotton Futures
By Dr. Aaron Smith, Associate Professor and Charles Martinez, Assistant Professor
Department of Agricultural and Resource Economics, University of Tennessee
Since mid-February, cotton and stock markets have plummeted due to the spread of the COVID-19 virus. The COVID-19 pandemic has reverberated through all sectors of the US and global economies. Probably the most effected of the agricultural commodities is cotton. Cotton is tied closely to global economic activity as, in general, clothing and other apparel purchases are not a necessity and can be delayed, unlike food. For this reason, there is a close correlation between stock markets, such as the S&P 500, and cotton futures (Figure 1).
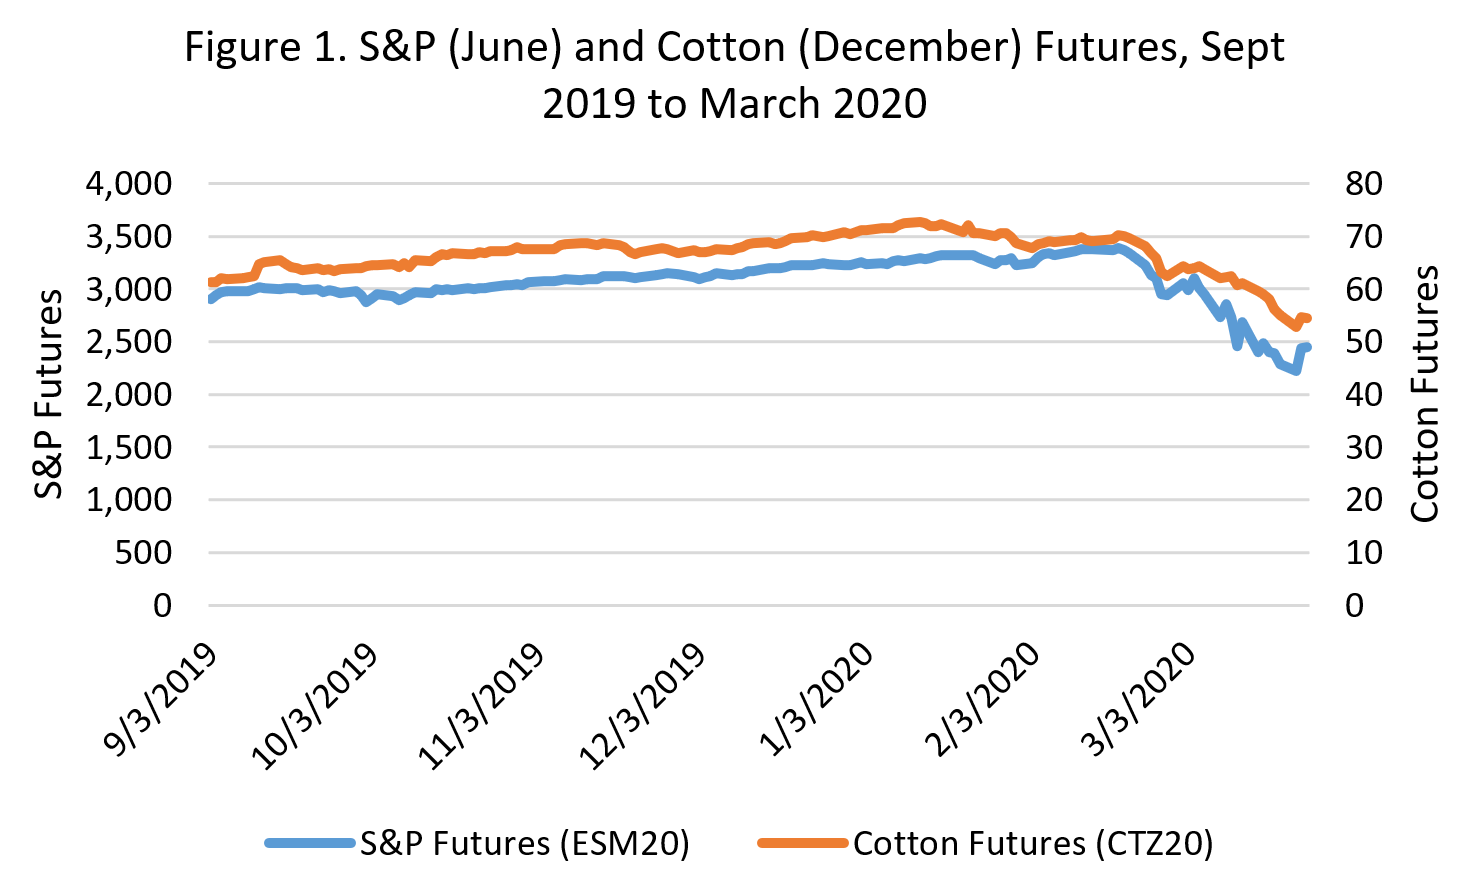 For example, the correlation between the June S&P 500 futures contract and the December ICE cotton contract from September 2019 to March 2020 was 0.915. The correlation coefficient is a statistical measure of the strength of the relationship between the relative movements of two variables. The values range between -1.0 and 1.0. A correlation of -1.0 shows a perfect negative correlation, while a correlation of 1.0 shows a perfect positive correlation. A correlation of 0.0 shows no linear relationship between the movements of the two variables. 0.915 is a very strong positive correlation between S&P futures and cotton futures. However, when we examine the impact of daily changes from September 2019 to March 2020 (Figure 2) a slightly different picture emerges from the data. Over the entire data set (September 2019 to March 2020) the correlation between the daily percent change in the June S&P futures contract and the December cotton futures contract was 0.58.
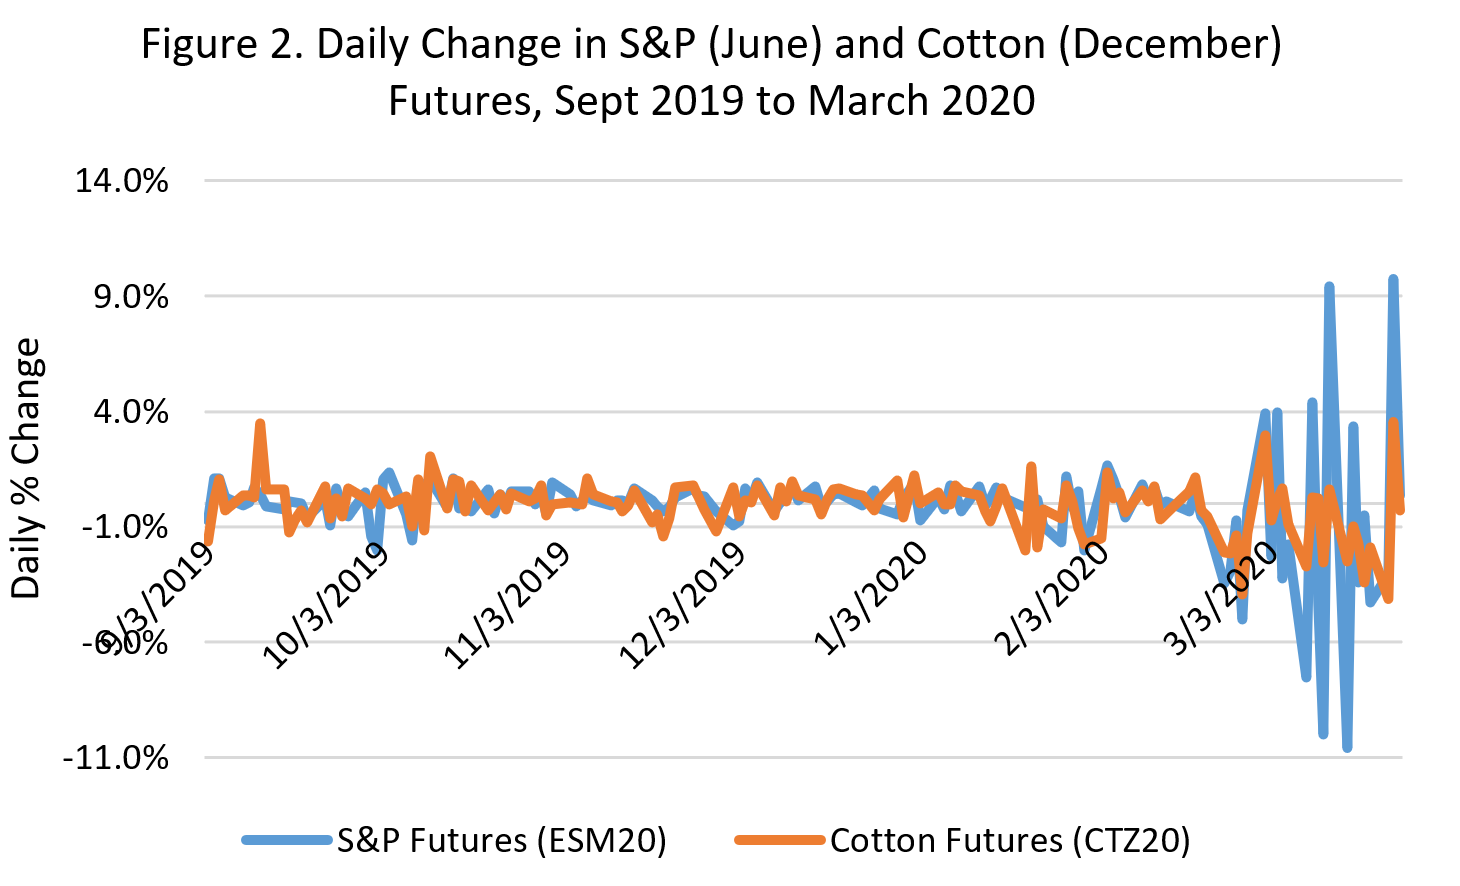 The two variables were still positively correlated. When we dissect the time intervals between pre-February 14 and post-February 14, a more interesting story emerges. Before February 14, the correlation between the two variables was 0.36. After February 14, the correlation was 0.69, or the two variables were moving more closely together after the COVID-19 virus was dominating markets. Visual inspection of the data (Figure 2) can be misleading as the magnitude of the daily change in S&P futures is more severe in March, however the markets are moving in the same direction. This scan level analysis uses a limited sample size so caution should be exerted when making definitive claims or inferences.
So what is the take away from this limited analysis? Markets can be disproportionately influenced by different factors at different times over the course of a year and right now global economic turmoil, as evidenced by the swings in the S&P 500, are influencing cotton prices more than when economic growth was stable and more predictable. Long term agricultural commodity prices, like cotton, will revert back to fundamentals (supply and demand) driving price changes. However, in the short-term US and global economic uncertainty will continue to influence agricultural markets, particularly cotton.
