Cotton Response to Sulfur Applications
Frank Yin, Assistant Professor and Systems Agronomist
Chris Main, Associate Professor and Extension Cotton Specialist
Sulfur deficiencies in cotton have been observed more frequently in recent years due to increased use of S-free fertilizers, greater removal of S from soil by crops with higher yields, lower S deposits to soil from the atmosphere, and less use of S-containing pesticides. Crop-available S is relatively low in some Cotton Belt soils due to low soil organic matter and the high likelihood of sulfate leaching. Light textured and well drained soils are more likely to be S deficient. No-till fields may exhibit S deficiency at times when soil temperatures are low, limiting S mineralization from organic matter. Little information is available about S application effects on cotton yields and fiber quality of economic importance in Tennessee and other states in the Cotton Belt region.
A replicated field trial was conducted on a non-irrigated Dexter loam soil at Jackson, TN during 2008-2010 to evaluate the S effects on cotton lint yields and fiber properties under no-tillage. Initial soil test S levels in the top 6 inches were rated low according to the A & L
Laboratories at Memphis. Four S application rates at 0, 10, 20, and 30 lb S per acre as potassium sulfate, were broadcast to designated plots before cotton planting each year. All plots received 80 lb N per acre and 120 lb K2O per acre each year. The cotton cultivar was ‘PHY 375 WRF’. Soil S content was measured using the Mehlich 3 method. Leaf blade samples were taken from the highest fully expanded main-stem leaves, usually three or four nodes from the terminal at early-bloom. Leaf samples were analyzed for total S concentrations.
S Deficiency Symptoms
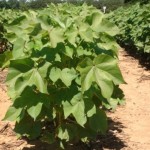
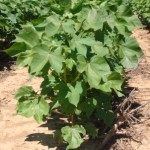
Sulfur deficiency symptoms gradually appeared in the zero-S plots by about 40 days after planting each year. Plants under zero S fertilization showed classical S-deficiency symptoms, such as pale green to yellow leaves in the upper part of plant, while 30 lb S per acre treated plants grew normally (Fig. 1). These symptoms became less apparent as the crop grew larger and began to set fruit at about 70 days after planting.
Fig. 1. Cotton plants fertilized with (A.) no sulfur, and (B.) 30 lb S per acre.
In-Season Soil Test S Levels
In 2008, applying 30 lb S per acre had higher soil test S level than the other three lower rates at mid-bloom (Table 1). In 2009, 30 lb S per acre tended to increase soil S level, although statistically insignificant, relative to the other S rates. In 2010, the 20 and 30 lb S per acre had higher soil S level than zero S. The 3-year average soil test S level at mid-bloom was 25% higher with 30 lb S per acre than zero S fertilization. Soil test S was higher in 2010 than in 2008 and 2009, reflecting the positive effects of higher temperatures during the 2010 summer on S release from soil organic matter.
Table 1. Soil S content at mid-bloom as affected by S application rates.
|
S rate |
2008 |
2009 |
2010 |
Average |
|
lb per acre |
——— pounds per acre ———- |
|||
|
0 |
27b† |
22a |
36c |
28c |
|
10 |
26b |
23a |
39bc |
29bc |
|
20 |
27b |
23a |
40b |
30b |
|
30 |
31a |
29a |
45a |
35a |
†Values in each column followed by different letters are statistically different at P = 0.05.
Leaf S Concentrations
Leaf S concentrations at early-bloom were consistently affected by S applications in all three years (Table 2). The 20 and 30 lb S per acre had higher leaf S levels than zero S each year. On average, leaf S concentrations were statistically different among the four S rates with 30 lb S per acre having the highest leaf S level.
Table 2.
Leaf S concentrations at early-bloom as affected by S application rates.
|
S rate |
2008 |
2009 |
2010 |
Average |
|
lb per acre |
———————— %————————- |
|||
|
0 |
0.28b† |
0.31b |
0.23d |
0.27d |
|
10 |
0.31b |
0.37b |
0.31c |
0.33c |
|
20 |
0.35a |
0.43ab |
0.37b |
0.38b |
|
30 |
0.38a |
0.45a |
0.40a |
0.41a |
†Values in each column followed by different letters are statistically different at P = 0.05.
Lint Yields
In 2008, application of 20 or 30 lb S per acre increased lint yields by 7 to 8% compared to zero S (Table 3). In 2009, lint yield response to S applications was nearly significant (P = 0.054). Lint yields tended to increase, although statistically insignificant, with S applications in 2010. It appears that high temperatures during the 2010 summer may have decreased cotton responses to S applications. Averaged over the three seasons, applying 20 or 30 lb S per acre increased lint yields by 8 to 9% over zero S.
Table 3. Lint yields at harvest as affected by S application rates.
|
S rate |
2008 |
2009 |
2010 |
Average |
|
lb per acre |
————————– pounds per acre ————————– |
|||
|
0 |
2083b† |
1280a |
1602a |
1655b |
|
10 |
2160ab |
1307a |
1728a |
1731ab |
|
20 |
2221a |
1413a |
1729a |
1788a |
|
30 |
2253a |
1388a |
1757a |
1799a |
†Values in each column followed by different letters are statistically different at P = 0.05.
Fiber Quality
Fiber micronaire responded to S applications in one out of three years (Table 4). The S applications produced 4 to 5% increases in micronaire compared to zero S in 2010. When the three-year results were combined, application of 10, 20, or 30 lb S per acre increased micronaire by 4 to 5% relative to zero S. However, other fiber quality properties including length, uniformity, strength, and elongation were not affected by S applications (data
not shown).
Table 4. Fiber micronaire at harvest as affected by S application rates.
|
S rate |
2008 |
2009 |
2010 |
Average |
|
lb per acre |
||||
|
0 |
4.32a† |
3.53a |
4.62b |
4.16b |
|
10 |
4.47a |
3.65a |
4.85a |
4.32a |
|
20 |
4.50a |
3.65a |
4.82a |
4.32a |
|
30 |
4.54a |
3.70a |
4.83a |
4.36a |
†Values in each column followed by different letters are statistically different at P = 0.05.
Summary
Applying about 20 lb S per acre can increase lint yields and fiber micronaire of cotton on no-till fields with low S levels in Tennessee and similar environments. More attention needs to be paid to potential S requirements of no-till cotton in Tennessee and other
cotton producing states where S deficiencies may become more common due to increased
use of low-S fertilizers, adoption of high yielding cultivars, more intensive cropping systems, and lower atmospheric S deposits.


