Choosing the optimal seeding rate is a critical component of any crop production system. With soybean it is no different. However, this conversation is a little different than corn.
Over the past century, crop production and yield have drastically increased. One of the many reasons for this is due to increasing our planting population or seeding rate.
More seeds = more plants = more fruit…right? Yes, but also, no…
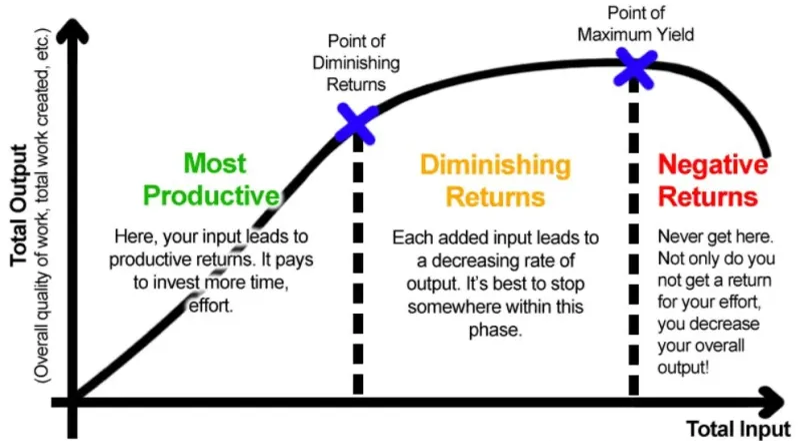
Nearly every agricultural input follows a dose response curve. Let’s use grain field for an example.
For every additional unit of input (seeding rate, nitrogen rate, etc..), the response is an additional unit of output (grain yield). However, at some point along this “curve” the additional yield per unit of additional input begins to decline, and the curved line becomes progressively flatter. At this point, there is no additional yield response from additional inputs.
At a further point, if inputs continue, the line (response) may turn negative, and the line begins to fall “back to earth”. In this case, yield decreases with additional inputs.
This is best expressed and understood as Mitscherlich’s Law of Diminishing Returns.
With corn, grain yield is often sensitive to seeding rate. It can vary by hybrid and environment, but there is usually a relatively narrow margin of seeding rates that are suitable for each hybrid under a given set of growing conditions.
With soybean, the conversation is different.
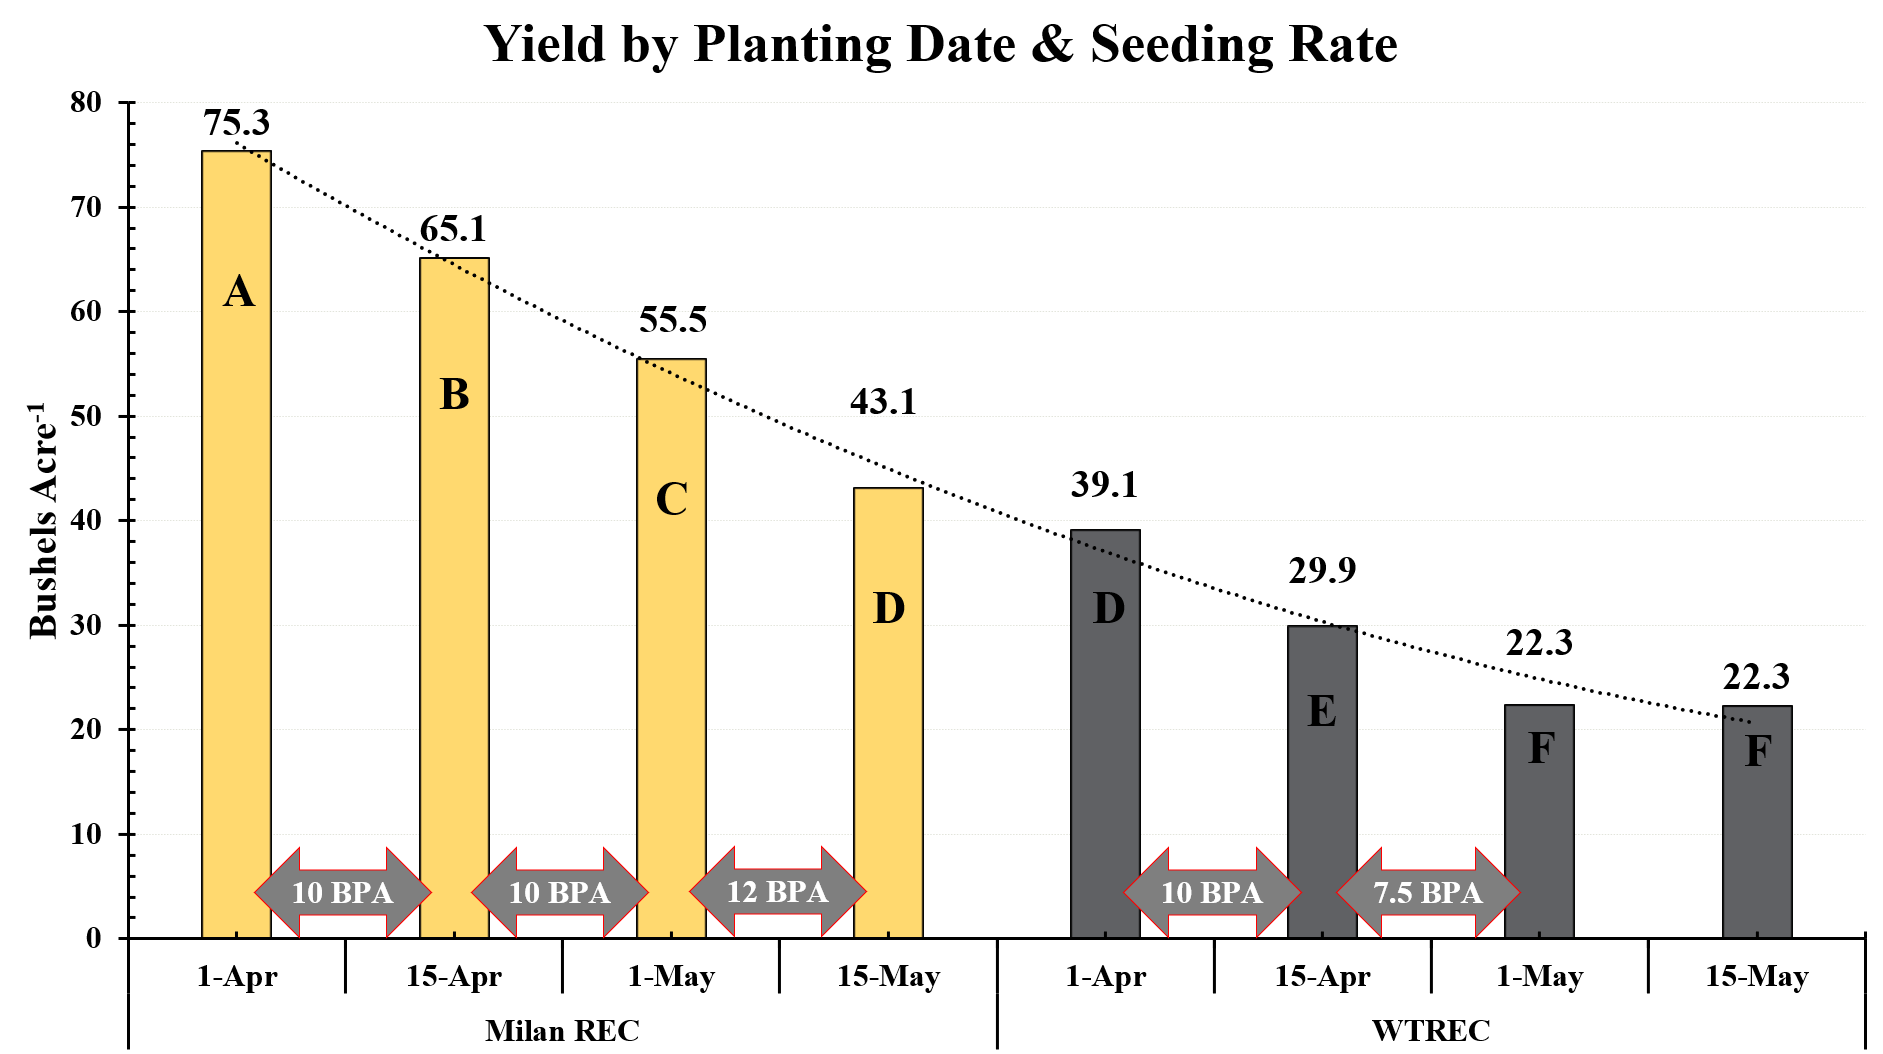
The first graph above is from a seeding rate x planting date study that us currently ongoing in West Tennessee. Across 2 locations in 2024, we saw no yield response due to seeding rates of between 80,000 and 200,000 seeds per acre (Figure 1 above). The yield curve across seeding rates is “flat”. That is, as seeding rate increases across this range, we see no consistent increase in soybean yield. The variation in yield as seed above was only due to planting date and location.
When seeding rate is the question, final plant stand is the answer.
As long as we achieved a final plant stand of at least 80,000 plants per acre, we were still in the 95%+ yield potential range. This has been the case in multiple studies across the United States in recent years. In the study referenced above, we achieved a final plant stand of at least 75,000 plants per acre across both locations even when planted on April 1st.
What seeding rate is required to achieve my desired final plant stand?
This depends on planting date and soil texture. With earlier planting dates, cooler soils, and heavier soil textures, a higher seeding rate may be required.
So in the case where there is no yield response across a wide range of additional inputs, what changes? Return On Investment. In this case, the dose response isn’t yield, it’s profitability as a function of seed cost. Higher seeding rates may mitigate some risk associated with low germination, and may aid in shading out row-middles as plants grow taller when they are planted thicker. However, soybeans are notorious for being able to compensate and will be more productive on a per-plant basis at lower seeding rates.
The first week of April this year has already thrown us a generational curveball with the amount of rainfall received. Some portions of west Tennessee have received in excess of 15” over the past 5 days. We have already initiated and will continue our planting date, maturity group, and seeding rate trials across the state and look forward to building on this dataset for Tennessee.
